Overview:
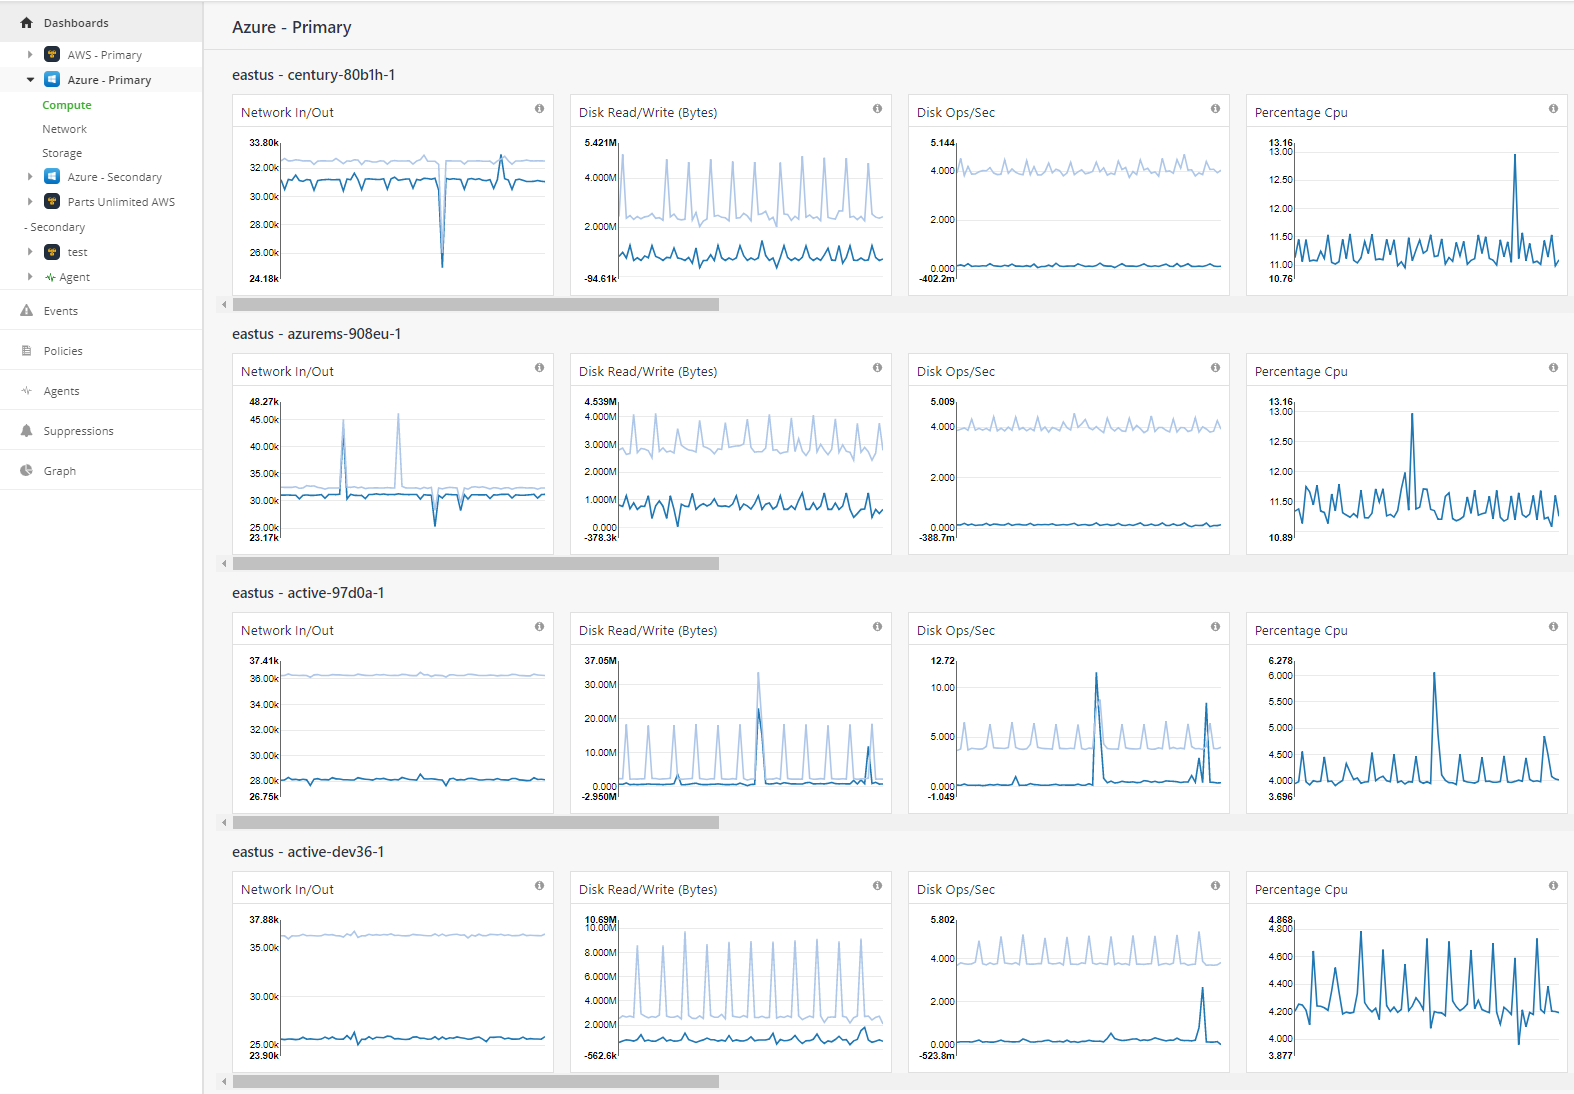
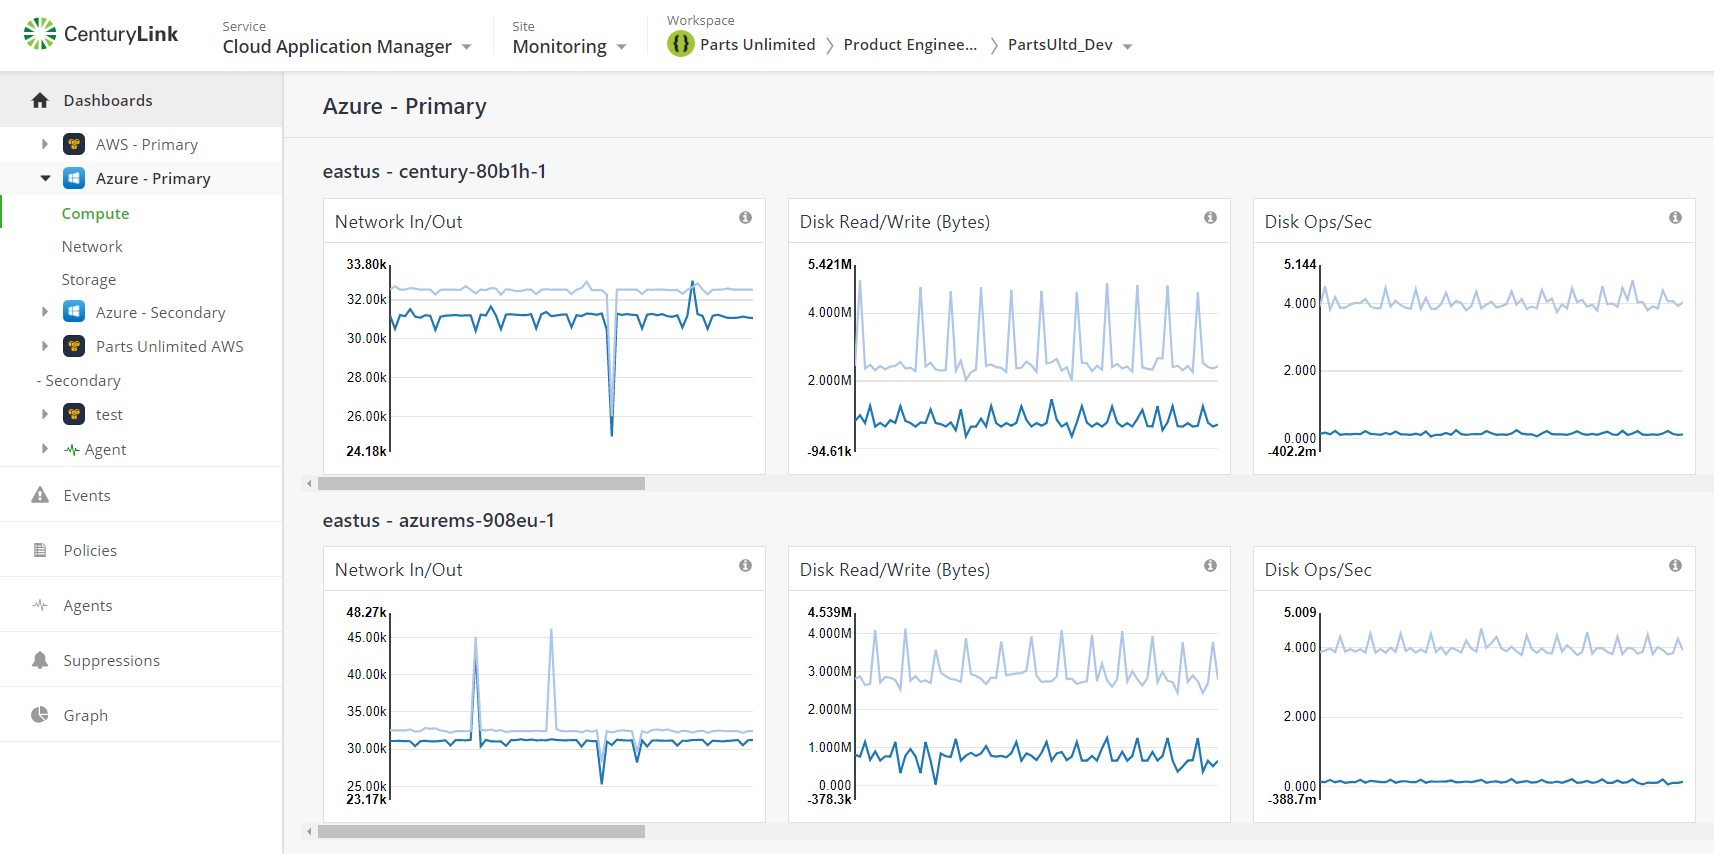
The Cloud Application Manager Monitoring dashboard allows customers to view cloud native monitoring data for Microsoft Azure & Amazon Web Services (AWS) providers. Our goal is to provide users of the Cloud Application Manager Monitoring site with Cloud Provider metrics and graphs for their infrastructure and services in AWS and Azure.
Features:
• User will be able to list & select providers configured within a Workspace
• All Application Insights resource types/namespaces are available to be viewed as individual dashboards
• Works for Azure providers where appropriate permissions are granted (within the provider) & configured in Cloud Application Manager
• Dashboard rows are organized by unique dimension in that namespace
• All regions are aggregated into each dashboard
• Upon selecting a Provider, the user will be able to see a subset of Azure services that can be selected to get a deeper level of metrics
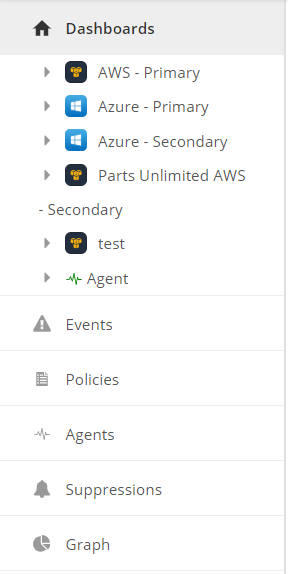
• The left navigation is dynamic and will only show the services the customer has set up for that specific provider
• Each individual dashboard will be likable and take the user to the appropriate graph page for deeper dives
• Graphs can be changed to a 1 hour, 4 hours, 12 hours, 1 day, 1 week, and 1 month time interval
Assumptions:
• User is setup as an admin in the workspace.
• Microsoft Azure provider is configured in Cloud Application Manager Provider console Using Microsoft Azure
Navigation
Left Navigation:
When a user navigates to the Cloud Application Manager Monitoring site they will see a Dashboard tab on the left-hand side. All configured AWS and Azure providers will be listed under the Dashboards tab. Only one provider may be opened at a time and only the metrics related to that provider are listed (dynamically loaded).
Lazy Loading:
When a user selects a service listed under their provider, all metrics associated with that service will be loaded. On the screen, just the graphs that are visible are loaded. As you scroll left/right or up/down the graphs will start loading. This is called lazy loading and improves performance by only loading the graphs that are visible.


